Live data across all U.S. options exchanges
What Moves The Market?
Not what you see on a chart.
Options Flow is a real-time options data and analytics tool that covers all U.S. exchanges. With it, traders like you can see live options order flow and gamma exposure. Track large retail and institutional activity in real time to find your edge.
Options Order Flow
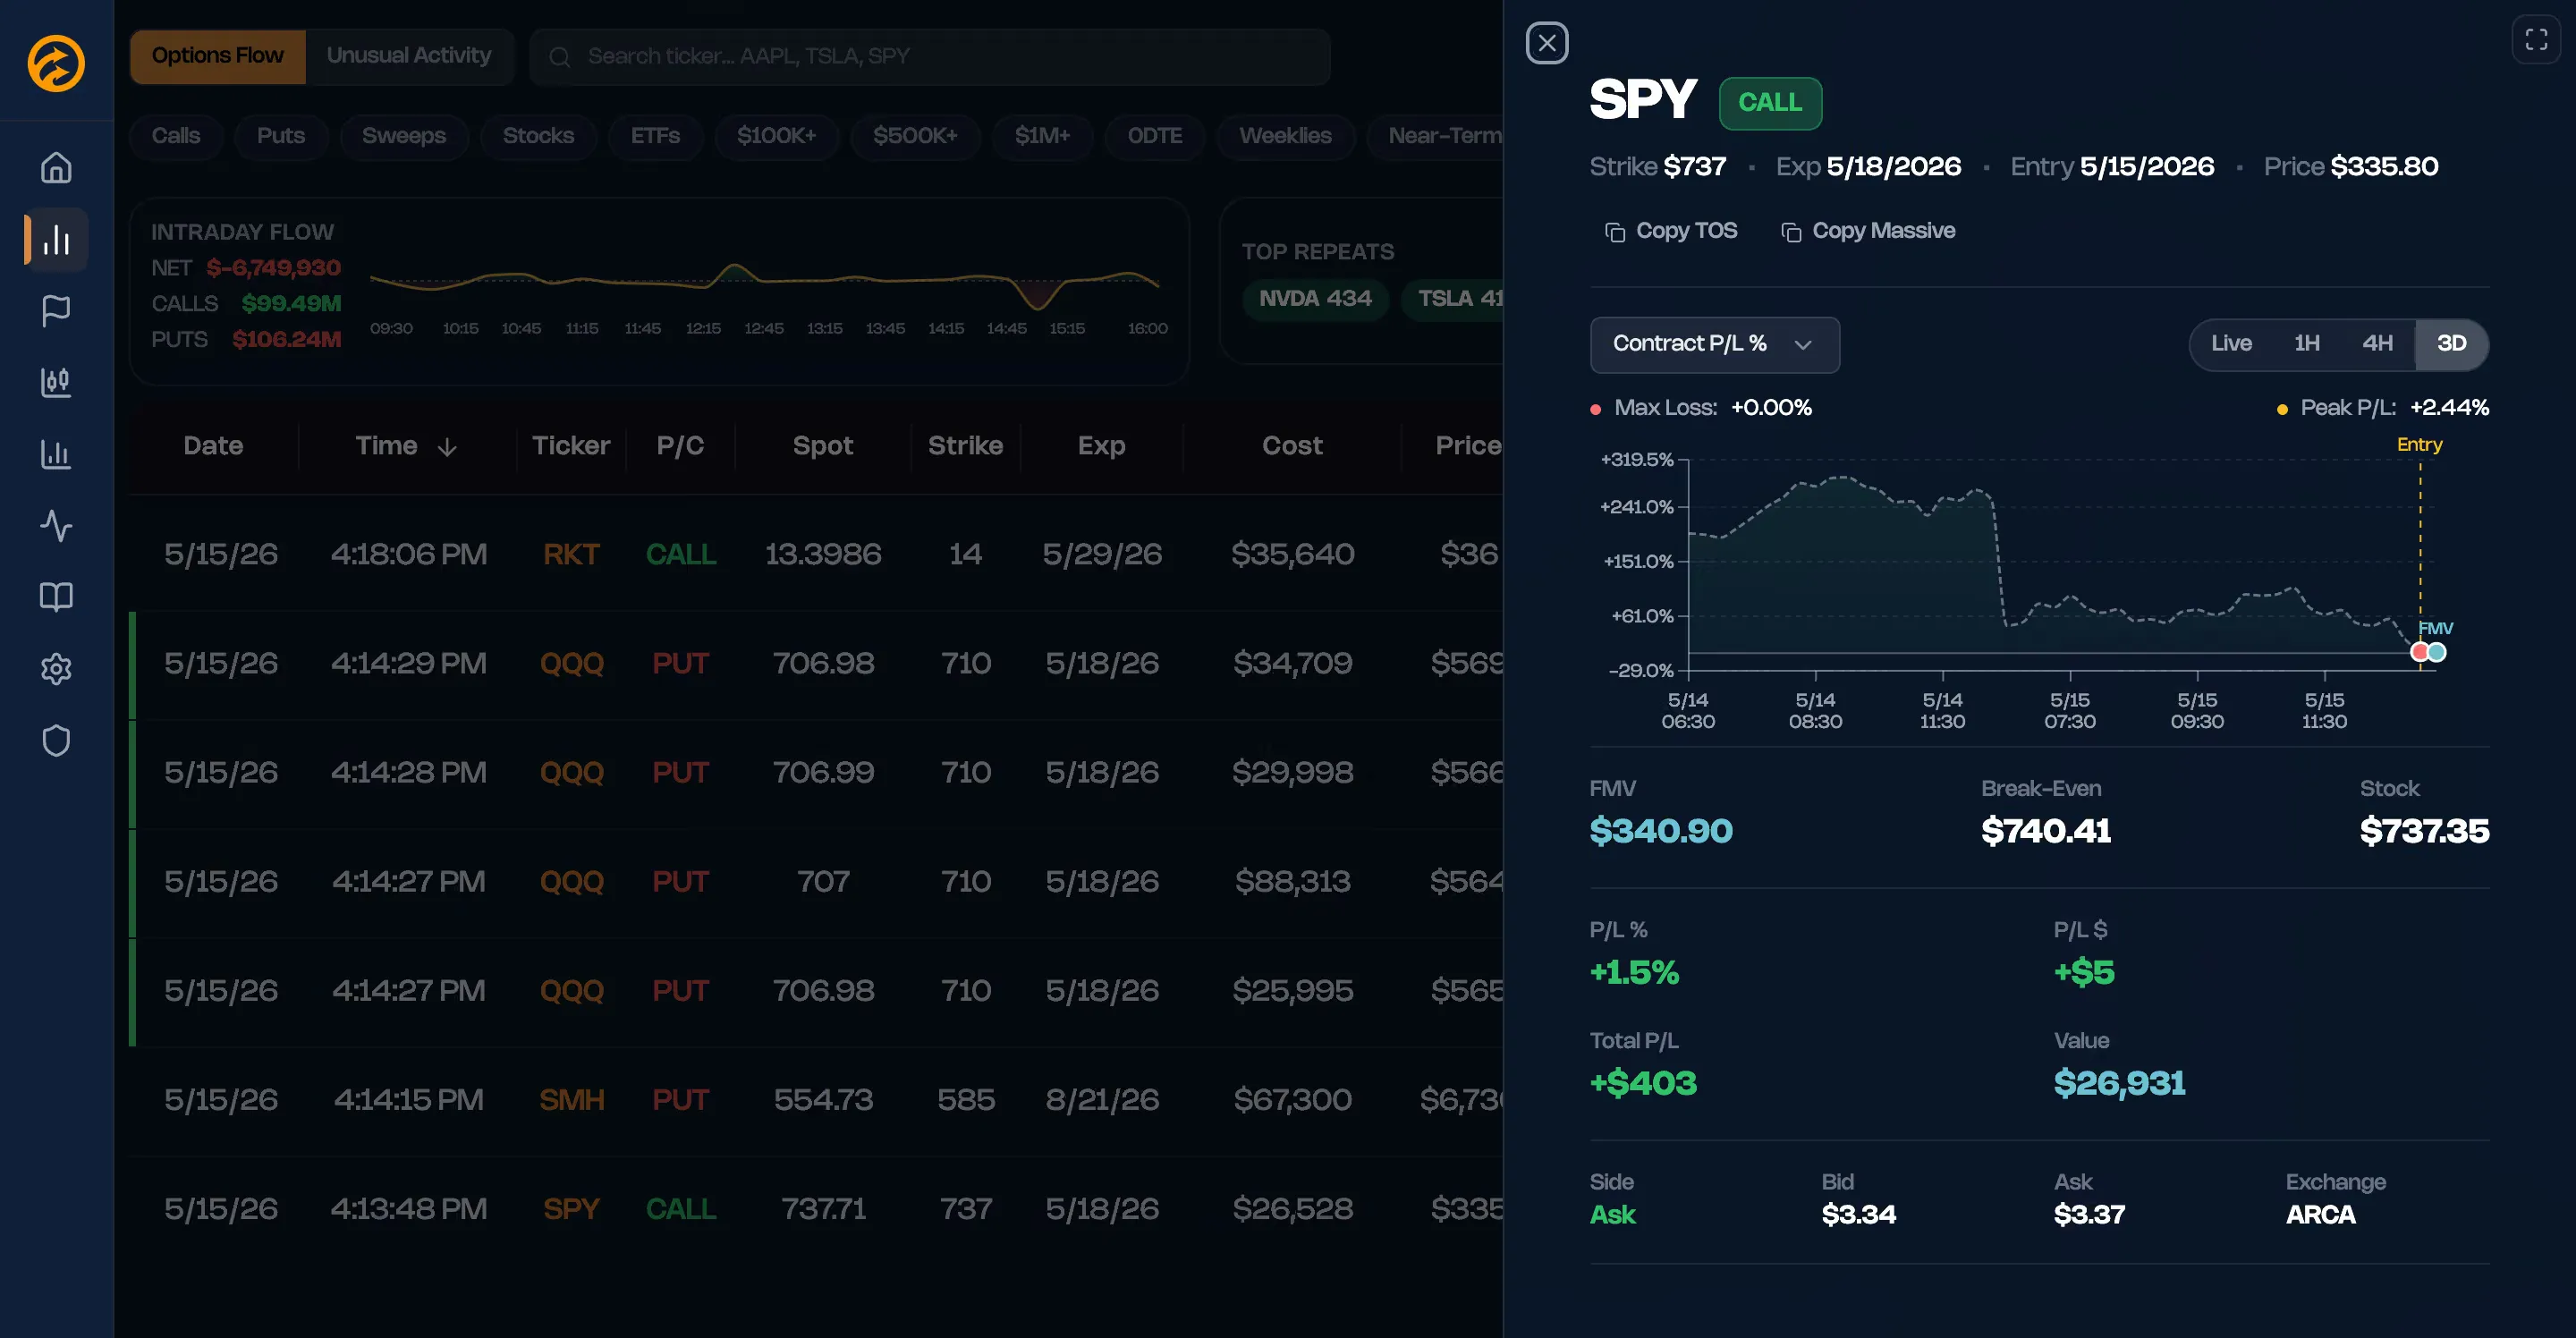
Every options print across every U.S. exchange, processed in real time. Two feeds — Options Flow for full market visibility, Unusual Activity for curated high-conviction trades — give you the scope that matches your strategy.
Five Signal Filters surface distinct patterns of informed activity — from aggressive entries to repeat accumulation. Pair them with Quick Filters for rapid segmentation by premium, DTE, trade type, and more.
| Date | Time | Ticker | P/C | Spot | Strike | Exp | Cost | Price | FMV | P/L % | Total P/L | Type | Sentiment | |
|---|---|---|---|---|---|---|---|---|---|---|---|---|---|---|
| 2/19/26 | 3:58:42 PM | SPY | CALL | 590.32 | 595 | 2/21/26 | $184,000 | $575 | $612 | +6.4% | +$11,840 | SWEEP | BULLISH | |
| 2/19/26 | 3:45:17 PM | NVDA | PUT | 135.28 | 130 | 2/28/26 | $278,000 | $232 | $187 | -19.4% | $-53,910 | BLOCK | BEARISH | |
| 2/19/26 | 3:32:08 PM | AAPL | CALL | 230.45 | 235 | 3/21/26 | $412,000 | $485 | $594 | +22.5% | +$92,605 | SWEEP | BULLISH | |
| 2/19/26 | 3:18:55 PM | TSLA | CALL | 350.67 | 360 | 3/21/26 | $456,000 | $651 | $812 | +24.7% | +$112,770 | BLOCK | BULLISH | |
| 2/19/26 | 3:05:33 PM | META | PUT | 650.12 | 645 | 2/21/26 | $318,000 | $530 | $421 | -20.6% | $-65,340 | SWEEP | BEARISH | |
| 2/19/26 | 2:51:21 PM | QQQ | CALL | 505.88 | 510 | 3/7/26 | $635,000 | $318 | $395 | +24.2% | +$153,850 | SWEEP | BULLISH | |
| 2/19/26 | 2:37:14 PM | MSFT | PUT | 420.34 | 415 | 2/21/26 | $95,000 | $317 | $208 | -34.4% | $-32,670 | BLOCK | BEARISH | |
| 2/19/26 | 2:24:09 PM | AMZN | CALL | 220.56 | 225 | 3/21/26 | $347,000 | $365 | $473 | +29.6% | +$102,660 | SWEEP | BULLISH | |
| 2/19/26 | 2:11:47 PM | GOOGL | CALL | 180.23 | 185 | 4/17/26 | $892,000 | $343 | $451 | +31.5% | +$280,860 | BLOCK | BULLISH | |
| 2/19/26 | 1:58:32 PM | AMD | PUT | 145.78 | 140 | 2/28/26 | $543,000 | $302 | $215 | -28.8% | $-156,330 | SWEEP | BEARISH | |
| 2/19/26 | 1:45:18 PM | NFLX | CALL | 625.40 | 640 | 3/21/26 | $397,000 | $361 | $528 | +46.3% | +$183,770 | BLOCK | BULLISH | |
| 2/19/26 | 1:32:05 PM | BKNG | PUT | 3950.25 | 3900 | 3/21/26 | $788,000 | $4147 | $3285 | -20.8% | $-163,882 | SWEEP | NEUTRAL | |
| 2/19/26 | 1:18:51 PM | SPY | PUT | 590.32 | 585 | 3/31/26 | $1,290,000 | $461 | $324 | -29.7% | $-383,370 | BLOCK | BEARISH | |
| 2/19/26 | 1:05:37 PM | V | CALL | 315.67 | 320 | 4/17/26 | $1,675,000 | $441 | $689 | +56.2% | +$941,800 | SWEEP | BULLISH | |
| 2/19/26 | 12:52:22 PM | MA | PUT | 495.88 | 490 | 3/21/26 | $234,000 | $360 | $245 | -31.9% | $-74,750 | BLOCK | BEARISH |
Key GEX Levels
SPYFeb 20, 2026
What is GEX?expand
Gamma Exposure (GEX) measures the net options gamma held by market makers at each strike price, expressed in dollars. When dealers are long gamma (positive GEX), they hedge by selling into rallies and buying dips — mechanically dampening volatility and creating price resistance zones. When dealers are short gamma (negative GEX), their hedging amplifies moves in both directions, turning those strikes into volatility acceleration zones. Understanding the GEX profile lets traders identify which price levels will act as magnets, walls, or launching pads before they're tested.
This is a point-in-time snapshot. Live GEX updates in real-time throughout the trading day.
Access Live GEX Data → Get StartedData shown is a point-in-time snapshot for illustration. Live GEX updates throughout the trading day.
Gamma Exposure & Dealer Positioning
GEX reveals the mechanical price levels where market maker hedging creates support and resistance. See gamma walls, flip points, and expected moves, visualized across any optionable ticker with four chart modes including candlestick overlay.
Analyzes Orders in the Flow
One click from the scanner opens a full order flow analysis workspace. Six chart tabs (Flow, P&L, Greeks, Heatmap, GEX, and Open Interest) in one interface. Track live positions as the market moves and review historical performance on any past flow signal.
Built by traders, for traders
Options Flow was created by traders who wanted clearer visibility into how options activity and positioning affect price. We built the platform to make powerful market data easier to access, understand, and apply.
How Traders Use the Platform
Watch the Flow
Monitor live options order flow and spot unusual activity as it happens across all U.S. exchanges.
Analyze the Signal
Click any trade for instant charts, P&L tracking, and Greeks — scoped to the exact contract.
Validate and Act
Cross-reference with GEX levels, historical performance, and flow trends before making your move.
Why Options Flow Stands Out
No Feature Gating
One plan, full access. No starter tiers that hide what you actually need.
Built In-House
Proprietary algorithms and direct exchange feeds. No third-party data resellers.
Affordable for Retail
Institutional-grade tools at a retail price point. Built by traders, for traders.
We Teach What We Build
From your first options flow to advanced GEX strategies. Structured paths to build your edge.
Flow Fundamentals
3 lessons · ~22 min
- 1. How to Read Options Flow
- 2. Dark Pool Trading Guide
- 3. Institutional Flow Tracking
GEX Mastery
5 lessons · ~34 min
- 1. What is Gamma Exposure?
- 2. GEX Levels Explained
- 3. How to Read GEX Charts
- 4. GEX Trading Strategies
- 5. GEX + Options Flow Together
0DTE Trading
3 lessons · ~18 min
- 1. What Are 0DTE Options?
- 2. 0DTE Options Flow Guide
- 3. 0DTE and GEX Levels
11 lessons · ~74 minutes · Free for everyone
Plus 150+ options terms explained in our glossary
Frequently Asked Questions
Option order flow for trading is the real-time stream of options orders as they hit the market. It reveals what institutional traders and large players are actually doing: buying calls, puts, the size of their positions. Options Flow surfaces these orders so you can see where the smart money is moving before a price move happens.
No. The platform is designed to be approachable for beginners while powerful enough for experienced traders. The scanner highlights the most significant orders automatically, so you don't need to parse every print. Many users start by simply watching the flow to learn how institutional traders position themselves.
Options Flow data focuses on signal over noise. The scanner algorithm filters millions of orders down to high-probability setups. Features like real-time P&L tracking, trade analysis, and customizable filters give you tools most platforms don't offer at this price point.
Cancel anytime. No long-term contracts, no cancellation fees. Monthly subscribers can cancel before their next billing cycle. Annual subscribers retain access for the full year.
See the signal, not the noise
Full platform access. No feature gating. Cancel anytime.
Cancel anytime. No commitment.